Measuring the Philippine Coastline.
Three fractal dimension estimators (box counting, rigid yardstick, and bending yardstick) applied to Philippine islands and lakeshores.
View Latest FindingsTheoretical Framework
From Classical Geometry to Fractional Dimensions
In Euclidean geometry, dimensions are whole numbers: a point (D = 0), a line (D = 1), a plane (D = 2), and a volume (D = 3). Cut a line into pieces 1/s as long and you get N = s1 copies. Do the same to a square and you get N = s2 copies.
In 1918, Felix Hausdorff extended dimension to non-integers. If scaling an object by 1/s gives N self-similar pieces, its Hausdorff-Besicovitch dimension satisfies N = (1/s)^D, so D = log(N) / log(1/s).
Cantor Dust
D = log(2)/log(3) ≈ 0.6309Delete the middle third of a segment, then repeat on every piece. What remains has zero length but uncountably many points, so its dimension falls between D = 0 and D = 1.
Koch Snowflake
D = log(4)/log(3) ≈ 1.2618Replace the middle third of each segment with two sides of an equilateral triangle (N = 4, s = 1/3). The result encloses a finite area with an infinitely long perimeter that has no tangent anywhere.
Sierpiński Gasket
D = log(3)/log(2) ≈ 1.5850Cut the central triangle out of an equilateral triangle, then repeat on the three that remain (N = 3, s = 1/2). The limit has zero area, and its dimension falls between a line (D = 1) and a plane (D = 2).
Hilbert Curve
D = log(4)/log(2) = 2.0000Each stage is a single path that never crosses itself. In the limit, the curve passes through every point of the unit square, so it fills the plane and has D = 2.
The Coastline Paradox in Nature
Benoit Mandelbrot (1967) observed that natural boundaries such as islands, bays, and lakes behave as statistical fractals. A smooth curve has D = 1. A real coastline does not behave that way. A shorter ruler picks up bays, coves, and points the longer one skipped, so the measured length keeps growing. Laguna de Bay's box-counting D in the database below is about 1.13. If construction such as a lakeshore road straightened its margin, D would move toward 1. Measuring D before and during construction gives a way to check for that.
Algorithm Implementation
Box Counting: A grid of boxes of size ε covers the boundary, and we count the boxes the shoreline passes through. For a fractal, the count grows as a power of 1/ε: N(ε) ∝ ε−D. The slope of log N against log(1/ε) estimates D.
Box Counting
Lay a grid over the shoreline and count the boxes it touches. Repeat with smaller boxes. On a log-log plot of count against inverse box size, the slope is the fractal dimension.
Rigid Yardstick
A straight stick of length L walks along the shoreline from start to finish, and we count the steps. Repeat with shorter sticks. How fast the step count grows gives the dimension.
Bending Yardstick
Our experimental variant. When the straight stick would cut across the coast, it hinges once at the most protruding vertex. On random Koch curves its estimates varied 4 to 5 times less than box counting on our default scale range, but read 0.01 to 0.02 low.
Estimator Pseudocode
The code is private for now. This pseudocode shows the steps all three estimators share.
FOR each measurement scale
    measure the shoreline with box, rigid-yardstick, or bending-yardstick rules
    record the scale and resulting count
END FOR

fit the slope of log(count) against log(inverse scale)
report the slope as the estimated fractal dimension
Accuracy on Curves with Known D
We tested the estimators on curves whose true dimension is known. On Koch and quadratic Koch curves, every estimator's error shrinks as detail increases. At the finest level tested, all three are within 1.6% of the true value. Box counting reads the Koch curve 2 to 3% high at middle levels, while the walks read both curves slightly low.
Real coasts are irregular, so we also used random Koch curves: each bump points to a random side, but the true D stays at 1.2619. Over 20 such curves per level, the bending yardstick had the smallest spread:
| Estimator | Bias, 4,097 points | Spread (sd), 4,097 points | Bias, 65,537 points | Spread (sd), 65,537 points |
|---|---|---|---|---|
| Box Counting | −0.0072 | 0.0254 | +0.0027 | 0.0096 |
| Rigid Yardstick | −0.0210 | 0.0125 | −0.0227 | 0.0047 |
| Bending Yardstick | −0.0240 | 0.0051 | −0.0103 | 0.0024 |
Preliminary. Bias is the mean error against the true D; spread is the standard deviation across 20 random curves, using the fixed 12-scale ladder. For detecting change, spread matters more than bias: a constant bias cancels when two dates are measured the same way, but spread does not. The bending yardstick's advantage is precision, not accuracy.
Computational Cost
For a shoreline of n points fitted over K = 12 scales, all three estimators should take time linear in n. The measurements agree. Each timing run is pinned to one CPU core, discards a warm-up run, and averages three wall-clock runs.
| Estimator | Theoretical cost | Why | Measured exponent |
|---|---|---|---|
| Box Counting | O(K·(n + Σ N(s))) | Every segment is traced through the grid, and each occupied cell N(s) adds work at each scale. | 0.995 ± 0.049 |
| Rigid Yardstick | O(K·n) | The walk only moves forward, so it visits each vertex once per scale. | 0.949 ± 0.052 |
| Bending Yardstick | ≤ O(K·B·n) | Stick placements split the coast into pieces, and each hinge only rescans its own stick's span. The bend budget B adds a constant factor, not a higher exponent. | 0.976 ± 0.032 |
Exponents are log-log fits of kernel time against point count on a square densified from 1,000 to 64,000 points, ± standard error. Box counting used to measure 1.43. The cause was the hash function in its cell counter: every cell in a grid row landed in the same probe chain. After the fix, a 128,000-point input runs in 30 ms instead of 408 ms, and the box counts are unchanged. On real shorelines each estimator takes a few milliseconds.
Parallel Version (MPI)
All three estimators also run under MPI. Box counting splits the grid into vertical strips that hold about the same number of segments. Each process counts only the cells in its own strip, so the strip counts add up to the serial count without exchanging cells.
A yardstick walk cannot be split, because each step starts where the last one ended. The unit of parallel work is one complete walk for one start vertex and one scale. Walking from many start points also improves the estimate. On the Koch snowflake, averaging 32 starts moves the rigid estimate from 1.2545 to 1.2613, against a true value of 1.2619.
| Workload | Points | Estimator | Speedup on 8 processes |
|---|---|---|---|
| Koch curve, level 10, one start | 3,145,728 | Box Counting (vs. serial program) | 2.2 to 2.4× |
| Laguna de Bay ring, 64 starts | 69,763 | Rigid Yardstick | 4.7 to 6.7× |
| Laguna de Bay ring, 64 starts | 69,763 | Bending Yardstick | 5.2 to 6.8× |
The parallel output matches the serial program exactly at every process count tested, and an automated test checks this. Walk speedups are measured against the same code on one process. Box counting gains less because the serial version is already fast and limited by memory bandwidth. These timings are preliminary: they come from one 8-core laptop (AMD Ryzen 7 5800H) that was also running other programs, and the ranges cover repeated runs, since the laptop's power settings changed timings by about 30%. We plan to repeat them on the ICS Compute Swarm.
Robustness of the Estimates
Each estimator hides choices that should not matter. A walk has a start point and a direction, a box grid has a position, and the shape has an orientation. We swept each one. None of them changes the running time, but all of them move D:
| Choice | Sweep | Effect on D (synthetic curves) | Effect on D (real shorelines) |
|---|---|---|---|
| Walk start & direction (both yardsticks) | 24 starts × 2 directions; open arcs walked both ways | Rigid sd 0.004–0.006; bending 0.002–0.006 | Laguna gap ≤ 0.017; Taal up to 0.05 between directions |
| Grid origin (box counting) | 4×4 sub-cell offset lattice | Koch curve sd 0.013 | Laguna sd ±0.022; Taal range 0.934–1.098 |
| Rotation | 0° to 80° | Box up to 0.035; walks up to 0.023 | Laguna: box 0.024, rigid 0.012, bending 0.010 |
| Coordinate noise | Random vertex jitter, 0.1× to 1× the mean segment length | Usually raises D; up to +0.059 at the largest jitter | Laguna, jitter of 0.25× segment length: +0.005 to +0.012 |
| Vertex density | Keep every 8th vertex | n/a | Laguna: +0.002 to +0.019; bending least affected |
| Scaling window | Fixed 12-scale ladder vs. best-fit window over ≥ 1.5 decades | Mean error on held-out curves: 1.43% vs. 0.86%; worst case 3.17% vs. 4.06% | Laguna D lower by up to about 0.04 with the best-fit window |
What this means: the absolute D of a real shoreline depends on these choices at the 0.01 to 0.04 level. Comparisons between dates or sites are valid only when one set of choices is applied to every input. The rotation sweep also exposed a bug in our scale ladder. It was sized by the bounding-box diagonal, which changes as a shape turns. Sizing it by the true diameter cuts the rigid walk's rotation spread on Laguna from 0.012 to 0; that fix is opt-in for now. On random fractal curves no window rule won everywhere, so we report both. The bending yardstick's bend budget saturates by K = 8 bends per stick, and headline tables use K = 1.
Review of Related Literature
Box counting is the standard baseline. Our rigid yardstick follows the digital compass walk of Shelberg, Moellering, and Lam (1982). Our experimental bending yardstick sits between that walking family and the constant-deviation variable-step (CDVS) convex-hull methods of Normant and Tricot (1991).
Philippine prior art is thin. Alova (2025) measured the Negros Island coastline at D = 1.018 by box counting on a GADM-derived coastline image. We found no published archipelago-wide values and no studies of Philippine lakes such as Laguna de Bay or Taal Lake from satellite-derived masks. To our knowledge, this is the first fractal study of Philippine shorelines that covers many features and compares algorithms.
Data Pipeline
NDWI Compositing for Two Lakes
We classify water in Sentinel-2 Harmonized Level-2A surface reflectance with the normalized difference water index (NDWI). Matched March composites and a 150 m morphological opening reduce passing clouds, hyacinth mats, and river branches.
Hugging Face Cross-Check
We scored five pretrained Hugging Face segmentation models against our NDWI rule on one March 2025 scene of the LLRN shoreline. The 6-band Sentinel-2 UNet++ (giswqs/s2-water-unetplusplus-efficientnet-b4) agreed with the rule at IoU 0.98 and rejected clouds that NDWI marks as water.
Monthly Series, 2017–2026
A pipeline streams Cloud-Optimized GeoTIFFs (COGs) from AWS Earth Search and computes FD for every usable month. The Laguna de Bay series has 112 monthly shorelines, which gives a baseline from before LLRN construction.
AWS Earth Search STAC Streaming
Streams only the lake's window of the Sentinel-2 L2A bands (B2, B3, B4, B8, B11, B12) and the Scene Classification Layer (SCL), without downloading full .SAFE archives.
Cloud & Shadow Filtering (SCL Mask)
Pixels the SCL marks as medium- or high-probability cloud, thin cirrus, or cloud shadow are set to invalid (NaN), so cloud edges are not traced as shoreline.
Matched-Date Temporal Median Stacking
Both lakes use the same seven March dates each year. We keep each pixel's clear-view count. Pixels never clear in a period stay nodata instead of becoming land.
Normalized Difference Water Index (NDWI)
NDWI = (Green − NIR) / (Green + NIR). Pixels with NDWI > 0.00 count as water and form a binary lake mask.
150 m Morphological Opening (River Snipping)
A 15×15 morphological opening cuts narrow river channels, such as the Napindan River, off the lake before the boundary is traced.
Fractal Estimation in C
C programs run box counting, rigid walks, and bending walks on the traced boundary, which has tens of thousands of vertices. They run serially or under MPI.
Where Pretrained Vision Models Fell Short
Before settling on temporal compositing and morphology, we tried pretrained segmentation models and classical edge filters on our imagery. The 6-band UNet++ above matched our rule. The others failed in ways that point to gaps in current remote-sensing models:
SAMGeo
SAMGeo, Meta's Segment Anything adapted for geospatial rasters, split floating water hyacinth rafts (Eichhornia crassipes) into tens of thousands of separate land patches. The result was many disjoint polygons instead of one closed lake boundary.
RGB-Only Models
Models that see only red, green, and blue did worse on Laguna's sediment-laden water. A generic water model labeled too much as water (precision 0.68). A zero-shot ADE20K model missed more than half the lake (recall 0.45). The 6-band model also reads the SWIR bands, which separate cloud from turbid water.
Single-Scene Edge Filters
Classical edge and threshold methods (Canny, Sobel, Otsu) on single-date scenes locked onto cloud shadows and the fringes of cumulus clouds. That pushed D above 1.35, so the estimate measured cloud complexity rather than the lake.
Possible Machine Learning Contributions
- Tropical turbidity benchmark: an open multispectral dataset of turbid, weed-covered tropical lake shorelines with checked SCL cloud masks, for fine-tuning geospatial models.
- Closed-boundary constraints: loss terms and polygonizers that keep a lake boundary as one closed loop, so floating weed mats do not create false holes.
- Fractal regularization: using consistent fractal scaling across resolutions as a self-supervised loss for coastline segmentation.
Archipelago Database
Nationwide Shoreline Survey
We ran the three C estimators on vector boundaries of 122 Philippine features (108 islands and 14 lakes) across Luzon, the Visayas, and Mindanao. To our knowledge, no archipelago-wide set of fractal dimensions existed before.
These values are preliminary. They use the fixed 12-scale ladder, and the sources differ in vertex density. Absolute D can shift by 0.01 to 0.04 with the window rule, so compare features with each other rather than with outside studies.
Philippine Shoreline Coverage Map
Hover over a dot for its D; click or tap it for detailsClick a row to see the feature's simplified outline and its box-counting log-log plot.
| Feature Name | Type | Island Group | Province / Region | Vertices | Perimeter (km) | Area (km²) | D (Box) | D (Rigid) | D (Bending) |
|---|---|---|---|---|---|---|---|---|---|
| Luzon↗ | Island | Luzon | NCR / Regions I-V / CAR | 55,454 | 5,365.98 | 104,870.09 | 1.1683 | 1.1598 | 1.1329 |
| Mindanao↗ | Island | Mindanao | Regions IX-XIII / BARMM | 47,852 | 4,427.25 | 93,965.24 | 1.1386 | 1.1458 | 1.1099 |
| Palawan↗ | Island | Luzon | Palawan | 24,225 | 2,074.31 | 11,416.84 | 1.1980 | 1.1363 | 1.1266 |
| Samar↗ | Island | Visayas | Samar / Eastern Samar / Northern Samar | 15,507 | 1,331.01 | 12,435.74 | 1.1627 | 1.1694 | 1.1507 |
| Negros↗ | Island | Visayas | Negros Occidental / Oriental | 9,643 | 894.32 | 12,775.14 | 1.0869 | 1.0679 | 1.0696 |
| Panay↗ | Island | Visayas | Iloilo / Capiz / Aklan / Antique | 8,726 | 920.49 | 11,517.21 | 1.1300 | 1.1330 | 1.1006 |
| Leyte↗ | Island | Visayas | Leyte / Southern Leyte | 9,123 | 868.92 | 7,007.1 | 1.1303 | 1.1143 | 1.0963 |
| Cebu↗ | Island | Visayas | Cebu | 7,594 | 686.72 | 4,417.93 | 1.1025 | 1.0624 | 1.0602 |
| Mindoro↗ | Island | Luzon | Occidental / Oriental Mindoro | 6,160 | 677.02 | 9,817.9 | 1.0819 | 1.0872 | 1.0717 |
| Bohol↗ | Island | Visayas | Bohol | 4,950 | 413.9 | 3,769.48 | 1.1239 | 1.0941 | 1.0906 |
| Masbate↗ | Island | Luzon | Masbate | 6,446 | 624.33 | 3,204.5 | 1.1524 | 1.1434 | 1.1147 |
| Catanduanes↗ | Island | Luzon | Catanduanes | 3,801 | 320.94 | 1,443.5 | 1.1665 | 1.1442 | 1.1320 |
| Basilan↗ | Island | Mindanao | Basilan | 3,073 | 250.43 | 1,234.9 | 1.1088 | 1.0998 | 1.0920 |
| Busuanga↗ | Island | Luzon | Palawan (Calamian) | 4,318 | 367.13 | 945 | 1.2371 | 1.2257 | 1.1595 |
| Marinduque↗ | Island | Luzon | Marinduque | 2,090 | 200.47 | 899.09 | 1.1571 | 1.1364 | 1.1111 |
| Jolo↗ | Island | Mindanao | Sulu | 3,488 | 275.1 | 834.69 | 1.1282 | 1.1111 | 1.1101 |
| Dinagat↗ | Island | Mindanao | Dinagat Islands | 4,166 | 349 | 780.17 | 1.2514 | 1.2071 | 1.1732 |
| Tablas↗ | Island | Luzon | Romblon | 2,694 | 240.79 | 671.17 | 1.1784 | 1.1376 | 1.1071 |
| Polillo↗ | Island | Luzon | Quezon | 2,601 | 240.13 | 646.03 | 1.1951 | 1.1840 | 1.1554 |
| Tawi-Tawi↗ | Island | Mindanao | Tawi-Tawi | 3,376 | 268.8 | 622.34 | 1.1757 | 1.1522 | 1.1260 |
| Guimaras↗ | Island | Visayas | Guimaras | 2,652 | 206.1 | 575.3 | 1.1734 | 1.1540 | 1.1309 |
| Biliran↗ | Island | Visayas | Biliran | 1,282 | 115.29 | 497.65 | 1.1082 | 1.0655 | 1.0575 |
| Sibuyan↗ | Island | Luzon | Romblon | 937 | 101.42 | 450.76 | 1.0882 | 1.0545 | 1.0422 |
| Siargao↗ | Island | Mindanao | Surigao del Norte | 1,791 | 150.83 | 427.22 | 1.1520 | 1.1189 | 1.0976 |
| Burias↗ | Island | Luzon | Masbate | 2,562 | 226.31 | 417.56 | 1.1926 | 1.1073 | 1.0836 |
| Culion↗ | Island | Luzon | Palawan (Calamian) | 3,313 | 278.09 | 387.44 | 1.2982 | 1.3131 | 1.2076 |
| Dumaran↗ | Island | Luzon | Palawan | 2,090 | 173.28 | 327.59 | 1.2306 | 1.2337 | 1.1503 |
| Ticao↗ | Island | Luzon | Masbate | 1,395 | 136.68 | 324.5 | 1.1369 | 1.1209 | 1.0907 |
| Siquijor↗ | Island | Visayas | Siquijor | 1,070 | 101.04 | 319.46 | 1.0902 | 1.0883 | 1.0754 |
| Balabac↗ | Island | Luzon | Palawan | 1,636 | 137.73 | 315.18 | 1.2286 | 1.1943 | 1.1318 |
| Samal (IGACOS)↗ | Island | Mindanao | Davao del Norte | 1,034 | 95.4 | 251.21 | 1.0877 | 1.0491 | 1.0498 |
| Camiguin↗ | Island | Mindanao | Camiguin | 647 | 66.69 | 242.4 | 1.0538 | 1.0378 | 1.0337 |
| Panaon↗ | Island | Visayas | Southern Leyte | 715 | 82.38 | 202.67 | 1.1042 | 1.0456 | 1.0430 |
| Calayan↗ | Island | Luzon | Cagayan (Babuyan) | 776 | 74.31 | 191.46 | 1.1281 | 1.1013 | 1.0598 |
| Lubang↗ | Island | Luzon | Occidental Mindoro | 992 | 97.69 | 194.46 | 1.1266 | 1.1277 | 1.0809 |
| Alabat↗ | Island | Luzon | Quezon | 1,013 | 96.96 | 188.41 | 1.1214 | 1.0375 | 1.0452 |
| Bantayan↗ | Island | Visayas | Cebu | 709 | 65.05 | 113.95 | 1.1091 | 1.0796 | 1.0699 |
| Camotes (Pacijan/Poro)↗ | Island | Visayas | Cebu | 1,086 | 92.68 | 195.23 | 1.1231 | 1.0904 | 1.0749 |
| Romblon Island↗ | Island | Luzon | Romblon | 610 | 55.99 | 81.69 | 1.1704 | 1.0890 | 1.0776 |
| Batan Island↗ | Island | Luzon | Batanes | 611 | 57.9 | 70.93 | 1.1385 | 1.0926 | 1.0701 |
| Itbayat↗ | Island | Luzon | Batanes | 760 | 55.4 | 84.06 | 1.0878 | 1.0472 | 1.0535 |
| Sabtang↗ | Island | Luzon | Batanes | 338 | 31.32 | 33.91 | 1.1628 | 1.0834 | 1.0396 |
| Coron Island↗ | Island | Luzon | Palawan (Calamian) | 972 | 73.2 | 71.81 | 1.1812 | 1.1490 | 1.1158 |
| Linapacan↗ | Island | Luzon | Palawan | 1,691 | 140.21 | 101.82 | 1.3242 | 1.3100 | 1.1769 |
| Mapun (Cagayan de Sulu)↗ | Island | Mindanao | Tawi-Tawi | 905 | 68.15 | 69.04 | 1.1816 | 1.1948 | 1.1144 |
| Semirara↗ | Island | Visayas | Antique | 812 | 70.84 | 66.72 | 1.1598 | 1.1925 | 1.1513 |
| Cuyo↗ | Island | Luzon | Palawan | 651 | 50.83 | 57.71 | 1.1375 | 1.1382 | 1.0997 |
| Jomalig↗ | Island | Luzon | Quezon | 292 | 35.78 | 51.82 | 1.0928 | 1.0419 | 1.0374 |
| Rapu-Rapu↗ | Island | Luzon | Albay | 535 | 46.67 | 64.52 | 1.1046 | 1.0667 | 1.0628 |
| Batan Island (Albay)↗ | Island | Luzon | Albay | 1,004 | 81.43 | 88.61 | 1.1903 | 1.1803 | 1.1486 |
| Cagraray↗ | Island | Luzon | Albay | 873 | 72 | 69.81 | 1.2116 | 1.2013 | 1.1579 |
| San Miguel (Albay)↗ | Island | Luzon | Albay | 397 | 33.8 | 21.73 | 1.2237 | 1.0999 | 1.1055 |
| Homonhon↗ | Island | Visayas | Eastern Samar | 608 | 60.71 | 103.2 | 1.1272 | 1.0507 | 1.0424 |
| Panglao↗ | Island | Visayas | Bohol | 516 | 51.24 | 90.82 | 1.0862 | 1.0577 | 1.0557 |
| Mactan↗ | Island | Visayas | Cebu | 735 | 61.49 | 60.5 | 1.2110 | 1.1013 | 1.0990 |
| Olango↗ | Island | Visayas | Cebu | 524 | 43.31 | 13.28 | 1.3242 | 1.4041 | 1.2179 |
| Bucas Grande↗ | Island | Mindanao | Surigao del Norte | 1,339 | 109.82 | 125.63 | 1.2044 | 1.2210 | 1.1713 |
| Patnanungan↗ | Island | Luzon | Quezon (Polillo) | 876 | 78.32 | 93.23 | 1.1550 | 1.1664 | 1.1093 |
| Balesin↗ | Island | Luzon | Quezon | 128 | 13.32 | 4.22 | 1.1254 | 1.0818 | 1.0790 |
| Fuga Island↗ | Island | Luzon | Cagayan (Babuyan) | 521 | 52.96 | 95.3 | 1.1267 | 1.0515 | 1.0528 |
| Camiguin Norte↗ | Island | Luzon | Cagayan (Babuyan) | 753 | 75.34 | 170.12 | 1.1031 | 1.0754 | 1.0746 |
| Dalupiri Island↗ | Island | Luzon | Cagayan (Babuyan) | 522 | 45.05 | 64.56 | 1.1201 | 1.0668 | 1.0699 |
| Babuyan Claro↗ | Island | Luzon | Cagayan (Babuyan) | 425 | 39.15 | 72.4 | 1.0763 | 1.0370 | 1.0316 |
| Sibutu↗ | Island | Mindanao | Tawi-Tawi | 820 | 83.87 | 104.72 | 1.1642 | 1.0853 | 1.1101 |
| Simunul↗ | Island | Mindanao | Tawi-Tawi | 404 | 35.94 | 39.99 | 1.1110 | 1.0820 | 1.0697 |
| Sanga-Sanga↗ | Island | Mindanao | Tawi-Tawi | 532 | 42.91 | 44.58 | 1.1269 | 1.1276 | 1.1024 |
| Pangutaran↗ | Island | Mindanao | Sulu | 463 | 57.63 | 96.54 | 1.1280 | 1.1223 | 1.0914 |
| Siasi↗ | Island | Mindanao | Sulu | 598 | 47.29 | 75.5 | 1.1227 | 1.0615 | 1.0990 |
| Lugus Island↗ | Island | Mindanao | Sulu | 294 | 30.43 | 36.78 | 1.1249 | 1.0693 | 1.1025 |
| Tapul Island↗ | Island | Mindanao | Sulu | 238 | 23.42 | 32.05 | 1.1510 | 1.0325 | 1.0429 |
| Pata Island↗ | Island | Mindanao | Sulu | 487 | 35.34 | 46.48 | 1.1050 | 1.0388 | 1.0669 |
| Laminusa↗ | Island | Mindanao | Sulu | 82 | 6.65 | 1.21 | 1.1535 | 1.0774 | 1.0471 |
| Olutanga↗ | Island | Mindanao | Zamboanga Sibugay | 1,611 | 123.43 | 189.04 | 1.1859 | 1.1548 | 1.0838 |
| Sacol Island↗ | Island | Mindanao | Zamboanga del Sur | 615 | 50.12 | 37.08 | 1.1765 | 1.1372 | 1.1575 |
| Talikud Island↗ | Island | Mindanao | Davao del Norte (IGACOS) | 223 | 21.52 | 27.73 | 1.1173 | 1.0399 | 1.0358 |
| Balut Island↗ | Island | Mindanao | Davao Occidental (Sarangani) | 574 | 44.35 | 53.86 | 1.2061 | 1.1015 | 1.0851 |
| Sarangani Island↗ | Island | Mindanao | Davao Occidental | 668 | 54.49 | 35.25 | 1.2529 | 1.2160 | 1.1542 |
| Hibuson↗ | Island | Mindanao | Dinagat Islands | 141 | 15.91 | 10.15 | 1.1735 | 1.0698 | 1.0581 |
| Boracay↗ | Island | Visayas | Aklan | 252 | 22.98 | 9.99 | 1.2313 | 1.0907 | 1.1249 |
| Sicogon↗ | Island | Visayas | Iloilo | 185 | 15.71 | 10.7 | 1.1333 | 1.0717 | 1.0614 |
| Gigantes Norte↗ | Island | Visayas | Iloilo | 100 | 9.71 | 4.48 | 1.0863 | 1.0307 | 1.0222 |
| Gigantes Sur↗ | Island | Visayas | Iloilo | 154 | 14.29 | 5.3 | 1.1805 | 1.0876 | 1.0589 |
| Pan de Azucar↗ | Island | Visayas | Iloilo | 344 | 28.54 | 16.27 | 1.2173 | 1.1813 | 1.0851 |
| Cabilao↗ | Island | Visayas | Bohol | 110 | 11.82 | 7.2 | 1.0329 | 1.0349 | 1.0337 |
| Lapinig↗ | Island | Visayas | Bohol | 933 | 74.34 | 45.05 | 1.2751 | 1.2315 | 1.1809 |
| Ponson (Camotes)↗ | Island | Visayas | Cebu | 422 | 32.16 | 33.74 | 1.1020 | 1.0311 | 1.0419 |
| Capul↗ | Island | Visayas | Northern Samar | 301 | 30.03 | 34.03 | 1.1275 | 1.0244 | 1.0294 |
| Batag↗ | Island | Visayas | Northern Samar | 546 | 44.33 | 32.13 | 1.2158 | 1.1362 | 1.1507 |
| Maripipi↗ | Island | Visayas | Biliran | 209 | 21.61 | 28.99 | 1.0724 | 1.0422 | 1.0278 |
| Suluan↗ | Island | Visayas | Eastern Samar | 130 | 11.29 | 4.65 | 1.1122 | 1.0770 | 1.0817 |
| Manicani↗ | Island | Visayas | Eastern Samar | 187 | 14.99 | 11.3 | 1.1241 | 1.0475 | 1.0456 |
| Carabao (Hambil)↗ | Island | Visayas | Romblon | 277 | 24.21 | 28.06 | 1.0884 | 1.0445 | 1.0437 |
| Banton↗ | Island | Luzon | Romblon | 320 | 28.68 | 28.6 | 1.2098 | 1.1085 | 1.0524 |
| Simara↗ | Island | Luzon | Romblon | 266 | 25.43 | 20.4 | 1.1867 | 1.0960 | 1.0477 |
| Maestro de Campo (Sibale)↗ | Island | Luzon | Romblon | 351 | 30.27 | 20.38 | 1.2621 | 1.2103 | 1.0939 |
| Ambil Island↗ | Island | Luzon | Occidental Mindoro (Lubang) | 350 | 31.71 | 28.85 | 1.1683 | 1.1773 | 1.0758 |
| Golo Island↗ | Island | Luzon | Occidental Mindoro | 387 | 35.36 | 21.09 | 1.2227 | 1.0434 | 1.0378 |
| Cabra Island↗ | Island | Luzon | Occidental Mindoro | 141 | 12.83 | 9.57 | 1.1167 | 1.0179 | 1.0199 |
| Caluya↗ | Island | Visayas | Antique | 257 | 23.33 | 24.33 | 1.1227 | 1.0529 | 1.0572 |
| Agutaya↗ | Island | Luzon | Palawan (Cuyo) | 214 | 17.64 | 14.92 | 1.1126 | 1.0275 | 1.0571 |
| Bugsuk↗ | Island | Luzon | Palawan | 553 | 55.46 | 122.37 | 1.1229 | 1.0612 | 1.0765 |
| Pandanan↗ | Island | Luzon | Palawan | 524 | 42.59 | 39.91 | 1.1543 | 1.1180 | 1.0667 |
| Cagayancillo↗ | Island | Luzon | Palawan | 388 | 31.49 | 7.7 | 1.2475 | 1.1606 | 1.0986 |
| Lahuy Island↗ | Island | Luzon | Camarines Sur (Caramoan) | 408 | 35.24 | 17.96 | 1.2558 | 1.2018 | 1.1535 |
| Quinalasag↗ | Island | Luzon | Camarines Sur | 806 | 65.8 | 31.96 | 1.3560 | 1.3101 | 1.1869 |
| Ibuhos Island↗ | Island | Luzon | Batanes | 105 | 11.03 | 6.18 | 1.0781 | 1.0361 | 1.0258 |
| Dequey Island↗ | Island | Luzon | Batanes | 47 | 4.15 | 0.82 | 1.0803 | 1.0508 | 1.0406 |
| Mavulis (Y'Ami)↗ | Island | Luzon | Batanes (Northernmost PH) | 68 | 5.72 | 1.31 | 1.1156 | 1.0477 | 1.0376 |
| Laguna de Bay↗ | Lake | Luzon | Laguna / Rizal | 11,799 | 301.1 | 790.91 | 1.1307 | 1.1235 | 1.1022 |
| Taal Lake↗ | Lake | Luzon | Batangas | 6,247 | 163.65 | 213.61 | 1.1698 | 1.1594 | 1.1553 |
| Lake Lanao↗ | Lake | Mindanao | Lanao del Sur | 9,727 | 123.64 | 342.71 | 1.0976 | 1.0954 | 1.0609 |
| Lake Mainit↗ | Lake | Mindanao | Agusan del Norte / Surigao del Norte | 7,578 | 84.18 | 138.86 | 1.0921 | 1.0995 | 1.0841 |
| Lake Naujan↗ | Lake | Luzon | Oriental Mindoro | 3,930 | 55.25 | 80.8 | 1.0964 | 1.1084 | 1.0776 |
| Lake Buluan↗ | Lake | Mindanao | Maguindanao / Sultan Kudarat | 1,944 | 58.21 | 71.37 | 1.1500 | 1.1336 | 1.0926 |
| Lake Bato↗ | Lake | Luzon | Camarines Sur | 2,026 | 37.7 | 25.14 | 1.1488 | 1.1882 | 1.1021 |
| Lake Buhi↗ | Lake | Luzon | Camarines Sur | 1,770 | 25.94 | 16.56 | 1.1768 | 1.1530 | 1.0866 |
| Lake Sebu↗ | Lake | Mindanao | South Cotabato | 392 | 125.16 | 818.41 | 1.1001 | 1.0374 | 1.0303 |
| Lake Caliraya↗ | Lake | Luzon | Laguna | 16,973 | 112.48 | 9.78 | 1.4375 | 1.4113 | 1.3146 |
| Lake Danao (Leyte)↗ | Lake | Visayas | Leyte | 312 | 7.3 | 1.4 | 1.1467 | 1.0748 | 1.0808 |
| Lake Paoay↗ | Lake | Luzon | Ilocos Norte | 1,236 | 15.28 | 3.15 | 1.1473 | 1.2119 | 1.1609 |
| Lake Wood↗ | Lake | Mindanao | Zamboanga del Sur | 721 | 14.22 | 7.23 | 1.0751 | 1.1012 | 1.0810 |
| Lake Balinsasayao↗ | Lake | Visayas | Negros Oriental | 75 | 47.94 | 78.75 | 1.1215 | 1.1019 | 1.0644 |
Flooded Valleys & Inlet-Rich Islands
The highest values belong to Lake Caliraya (D = 1.4375), a reservoir that flooded a branching river valley, and to islands with many inlets: Quinalasag (D = 1.3560), Linapacan (D = 1.3242), and Culion (D = 1.2982).
The Main Islands
The largest islands sit in the middle of the range. Luzon has D = 1.1683 over a 5,366 km perimeter. Samar (D = 1.1627), Mindanao (D = 1.1386), and Negros (D = 1.0869) follow. Their bays span many scales.
Compact Islands & Lakes
The lowest values belong to compact islands such as Cabilao (D = 1.0329) and Camiguin (D = 1.0538). Lakes such as Lake Wood (D = 1.0751) and Lake Mainit (D = 1.0921) are also low. Their outlines are close to smooth curves.
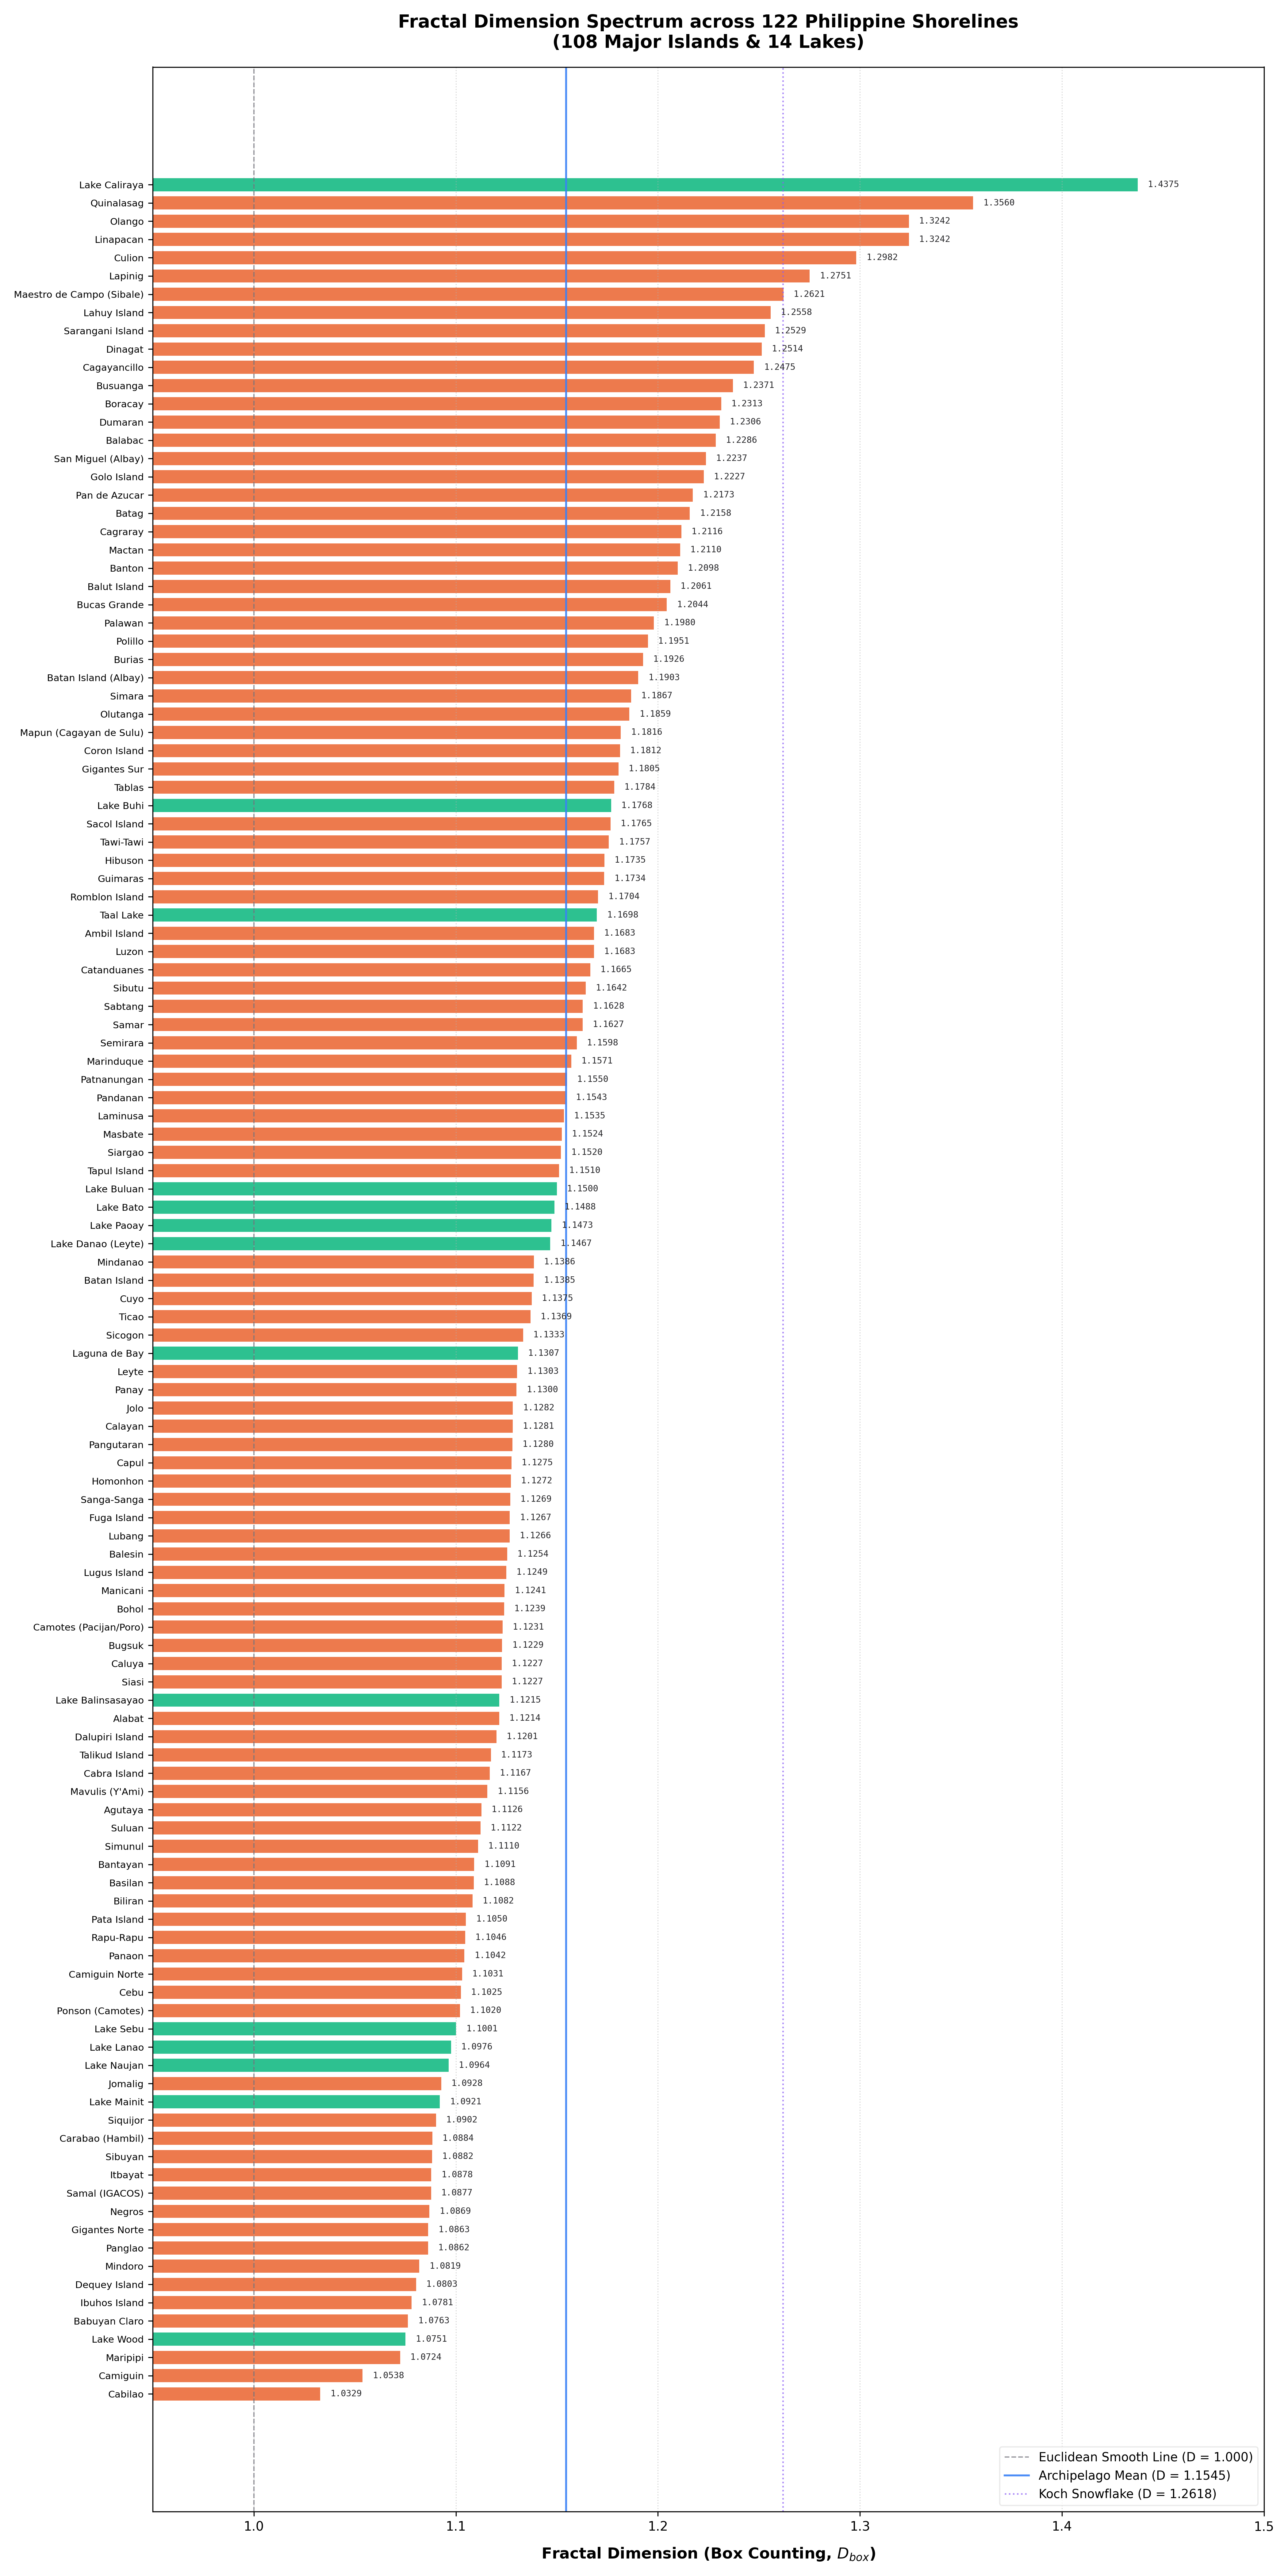
Box-counting D for 122 Philippine shorelines (108 islands and 14 lakes). Orange: islands. Green: lakes. Reference lines mark a smooth curve (D = 1.0), the national mean (D = 1.1545), and the Koch snowflake (D = 1.2618).
Findings
Multi-Temporal Composite Verification
In the tropics, a single-date scene often has cumulus clouds that break up the extracted water boundary. Compositing matched dates reduces this. Pixels that were never clear stay marked as unknown, and we report them as a limitation.
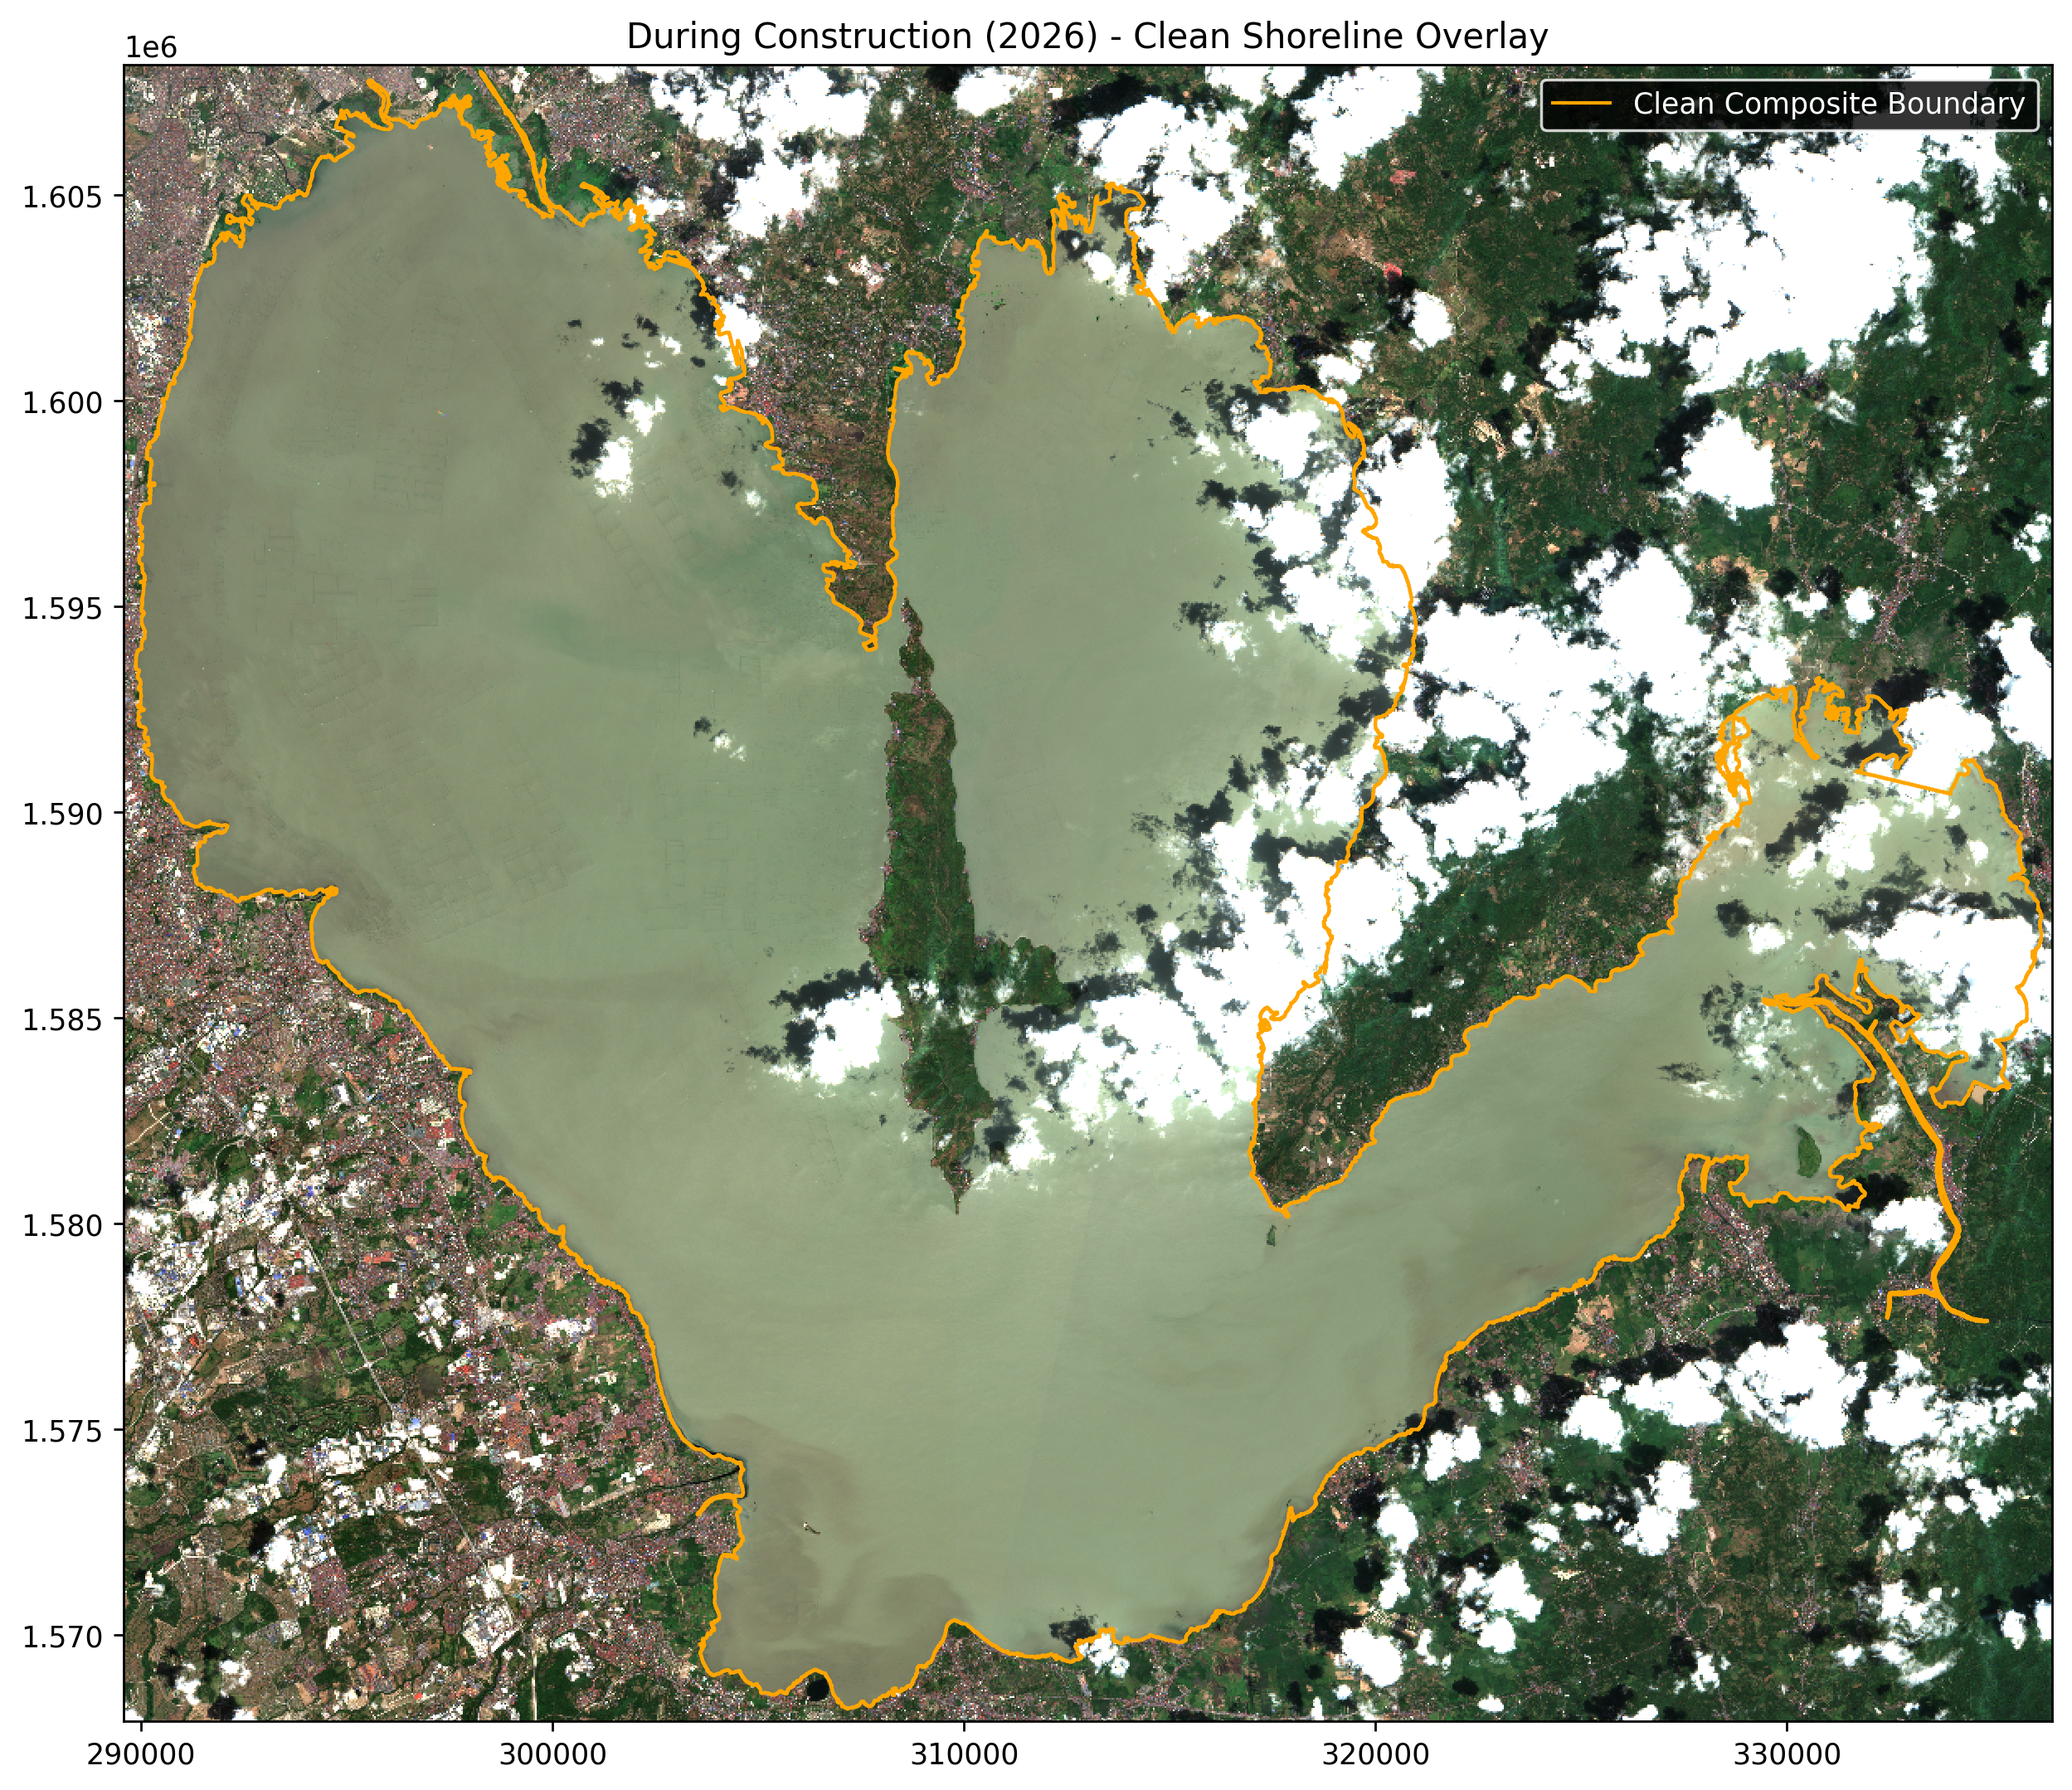
Laguna de Bay, March 2026 (Sentinel-2B), with the traced boundary overlaid. The boundary follows the urban West Bay at left, where LLRN Phase I runs along the shore. It wraps around forested Talim Island in the center and continues into the eastern bay. The straight feature crossing the lower-left shore is the Napindan Channel crossing; the 150 m rule removes the narrow channel. Faint grids in the West Bay are fishpens, which read as water. Leftover clouds at upper right are excluded, not traced.
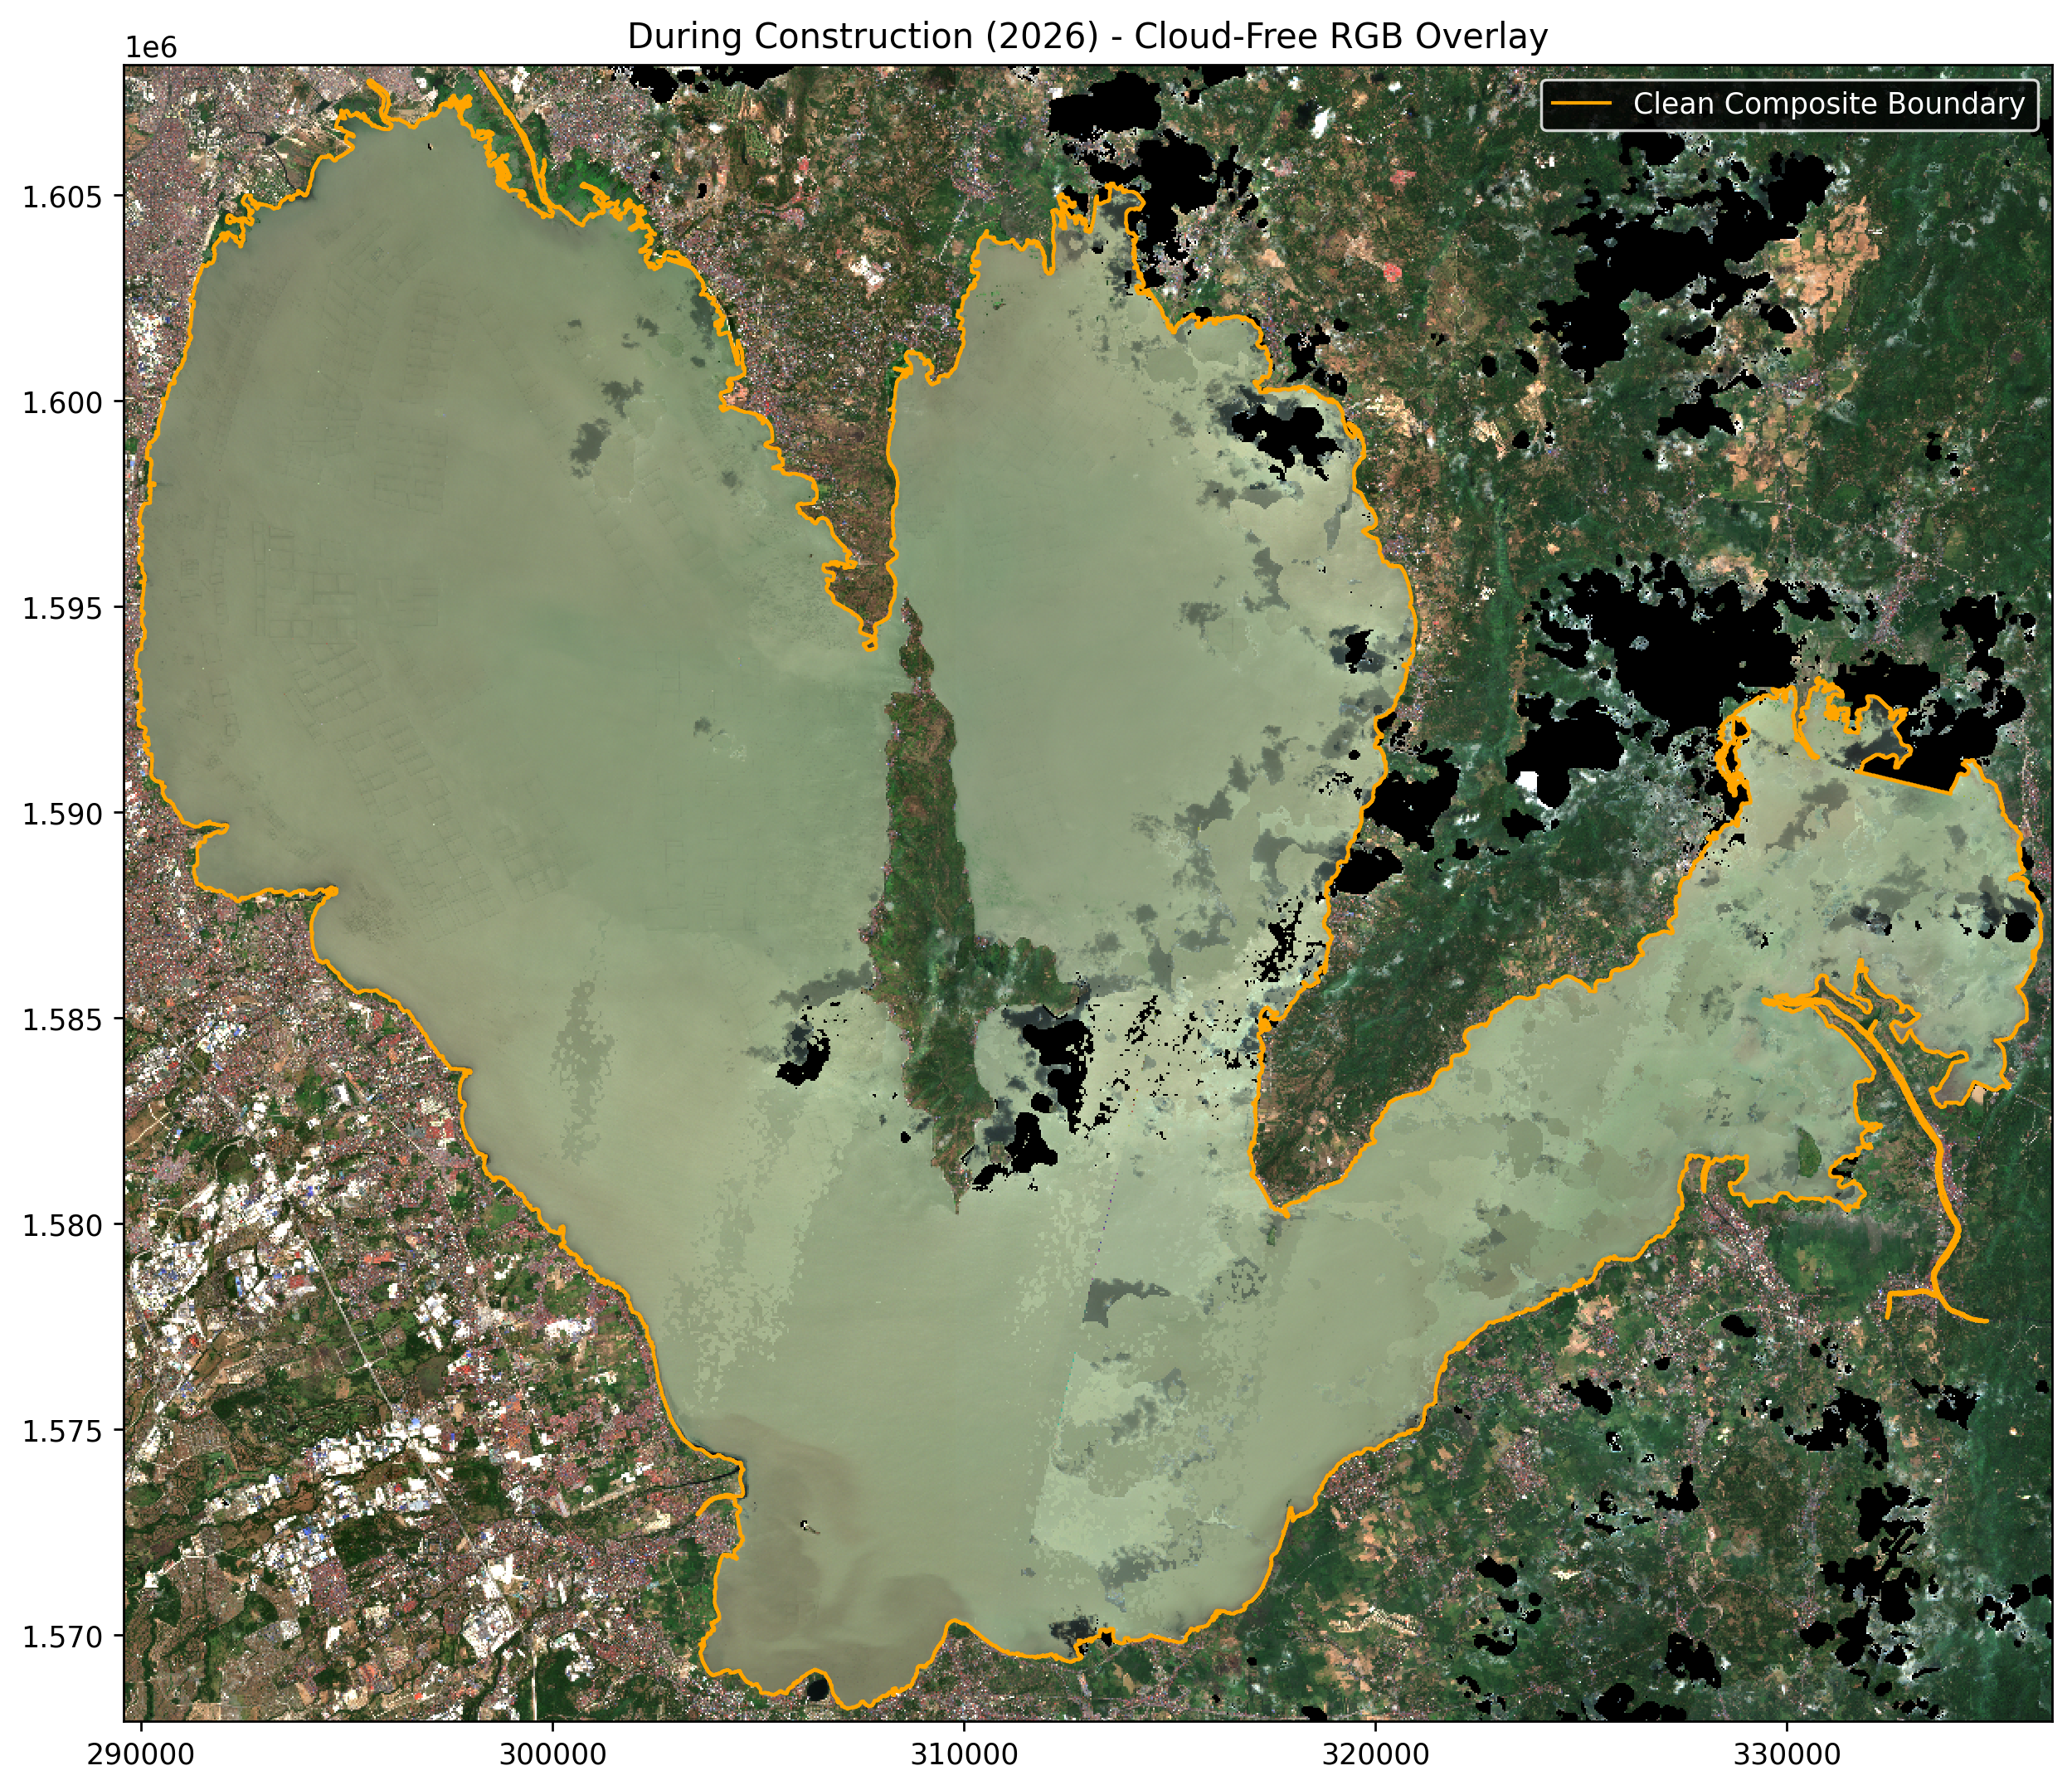
March 2026 median composite of seven observations. Black holes are pixels that were never cloud-free during the month, mostly over the eastern ridges and a persistent cloud cluster east of Talim Island. They count as unknown, not land. Sediment plumes show along the shallow western shore. Each pixel is the median of up to seven views. A single passing cloud or floating mat of vegetation does not reach the measured boundary.
LLRN Shoreline Monitoring
Has the Laguna Lakeshore Road Network Changed the Shoreline?
The Laguna Lakeshore Road Network (LLRN) may change the lake margin. Shoreline geometry alone cannot show hydrologic, ecological, or public-health effects.
We used Sentinel-2 imagery from seven March dates per year. Both Laguna and Taal went through NDWI, cloud masking, temporal median compositing, and the same 150 m morphology rule. Never-clear pixels stay nodata. FD is computed in open mode, only on shoreline arcs that were clear in both periods and match within 150 m. We also walked each arc in both directions.
On the 38.3 km common-clear Laguna March arc, the changes were +0.0003 for box, +0.0016 for rigid, and +0.0011 for bending. A January–March window was also near zero. Walking a Laguna arc in reverse moves D by up to 0.017, more than these changes. None of the Laguna changes kept its sign across the window and grid choices we tried.
On the LLRN Phase I corridor, the January–March walks rose by about 0.005. To see whether that is unusual, we built a monthly FD series for the corridor itself (2017–2026, 62 usable months). Corridor D varies by about 0.02 from month to month, four times that rise. Every 2026 month through July falls inside the range of the same calendar month in 2017–2025.
Taal Lake, measured on the same dates as a reference, is less stable. Its March arcs are only about 8 km long. The rigid decrease of −0.0268 becomes +0.0005 when the arc is walked the other way, so we do not read it as a decrease. Over January–March, Taal dropped slightly (−0.006 to −0.010) under every choice. Dates can differ for reasons unrelated to construction, such as water level and season.
Preliminary conclusion: no LLRN-associated change in shoreline FD is detectable at Sentinel-2 resolution through July 2026. These measurements form a baseline for later construction. A disease analysis would also need population-normalized incidence and a direct hydrologic measure.
Mosquito-Borne Disease Data Readiness
This table shows which public records exist, not disease rates. It explains why we cannot yet estimate a shoreline–disease correlation without claiming more precision than the records allow.
| Disease | Public record found | Spatial match to shoreline FD | Current inference |
|---|---|---|---|
| Dengue | ● Partial Laguna municipality counts (2012–2021); Batangas barangay records released for 2023–2026; a public weekly province-level series for Laguna (2016–2021). | Not yet matched to lake segments, population, or dates. | Most promising; needs a compiled, population-normalized time series. |
| Malaria | ● Aggregate FHSIS historical reporting, not a shoreline-scale series. | Insufficient. | Do not test or claim an association. |
| Chikungunya | ● No usable local series FHSIS does not collect it. | Unavailable. | Do not test or claim an association. |
| Japanese encephalitis | ● No usable local series FHSIS does not collect it. | Unavailable. | Do not test or claim an association. |
| Zika | ● No locality time series located | Unavailable. | Do not test or claim an association. |
Sources: DOH eFOI Laguna dengue municipality request; DOH eFOI Batangas dengue release; and DOH eFOI FHSIS vector-disease response. A valid test still requires case counts, population denominators, time lags, and a direct water-stagnation measure.
Shoreline Geometry Analysis
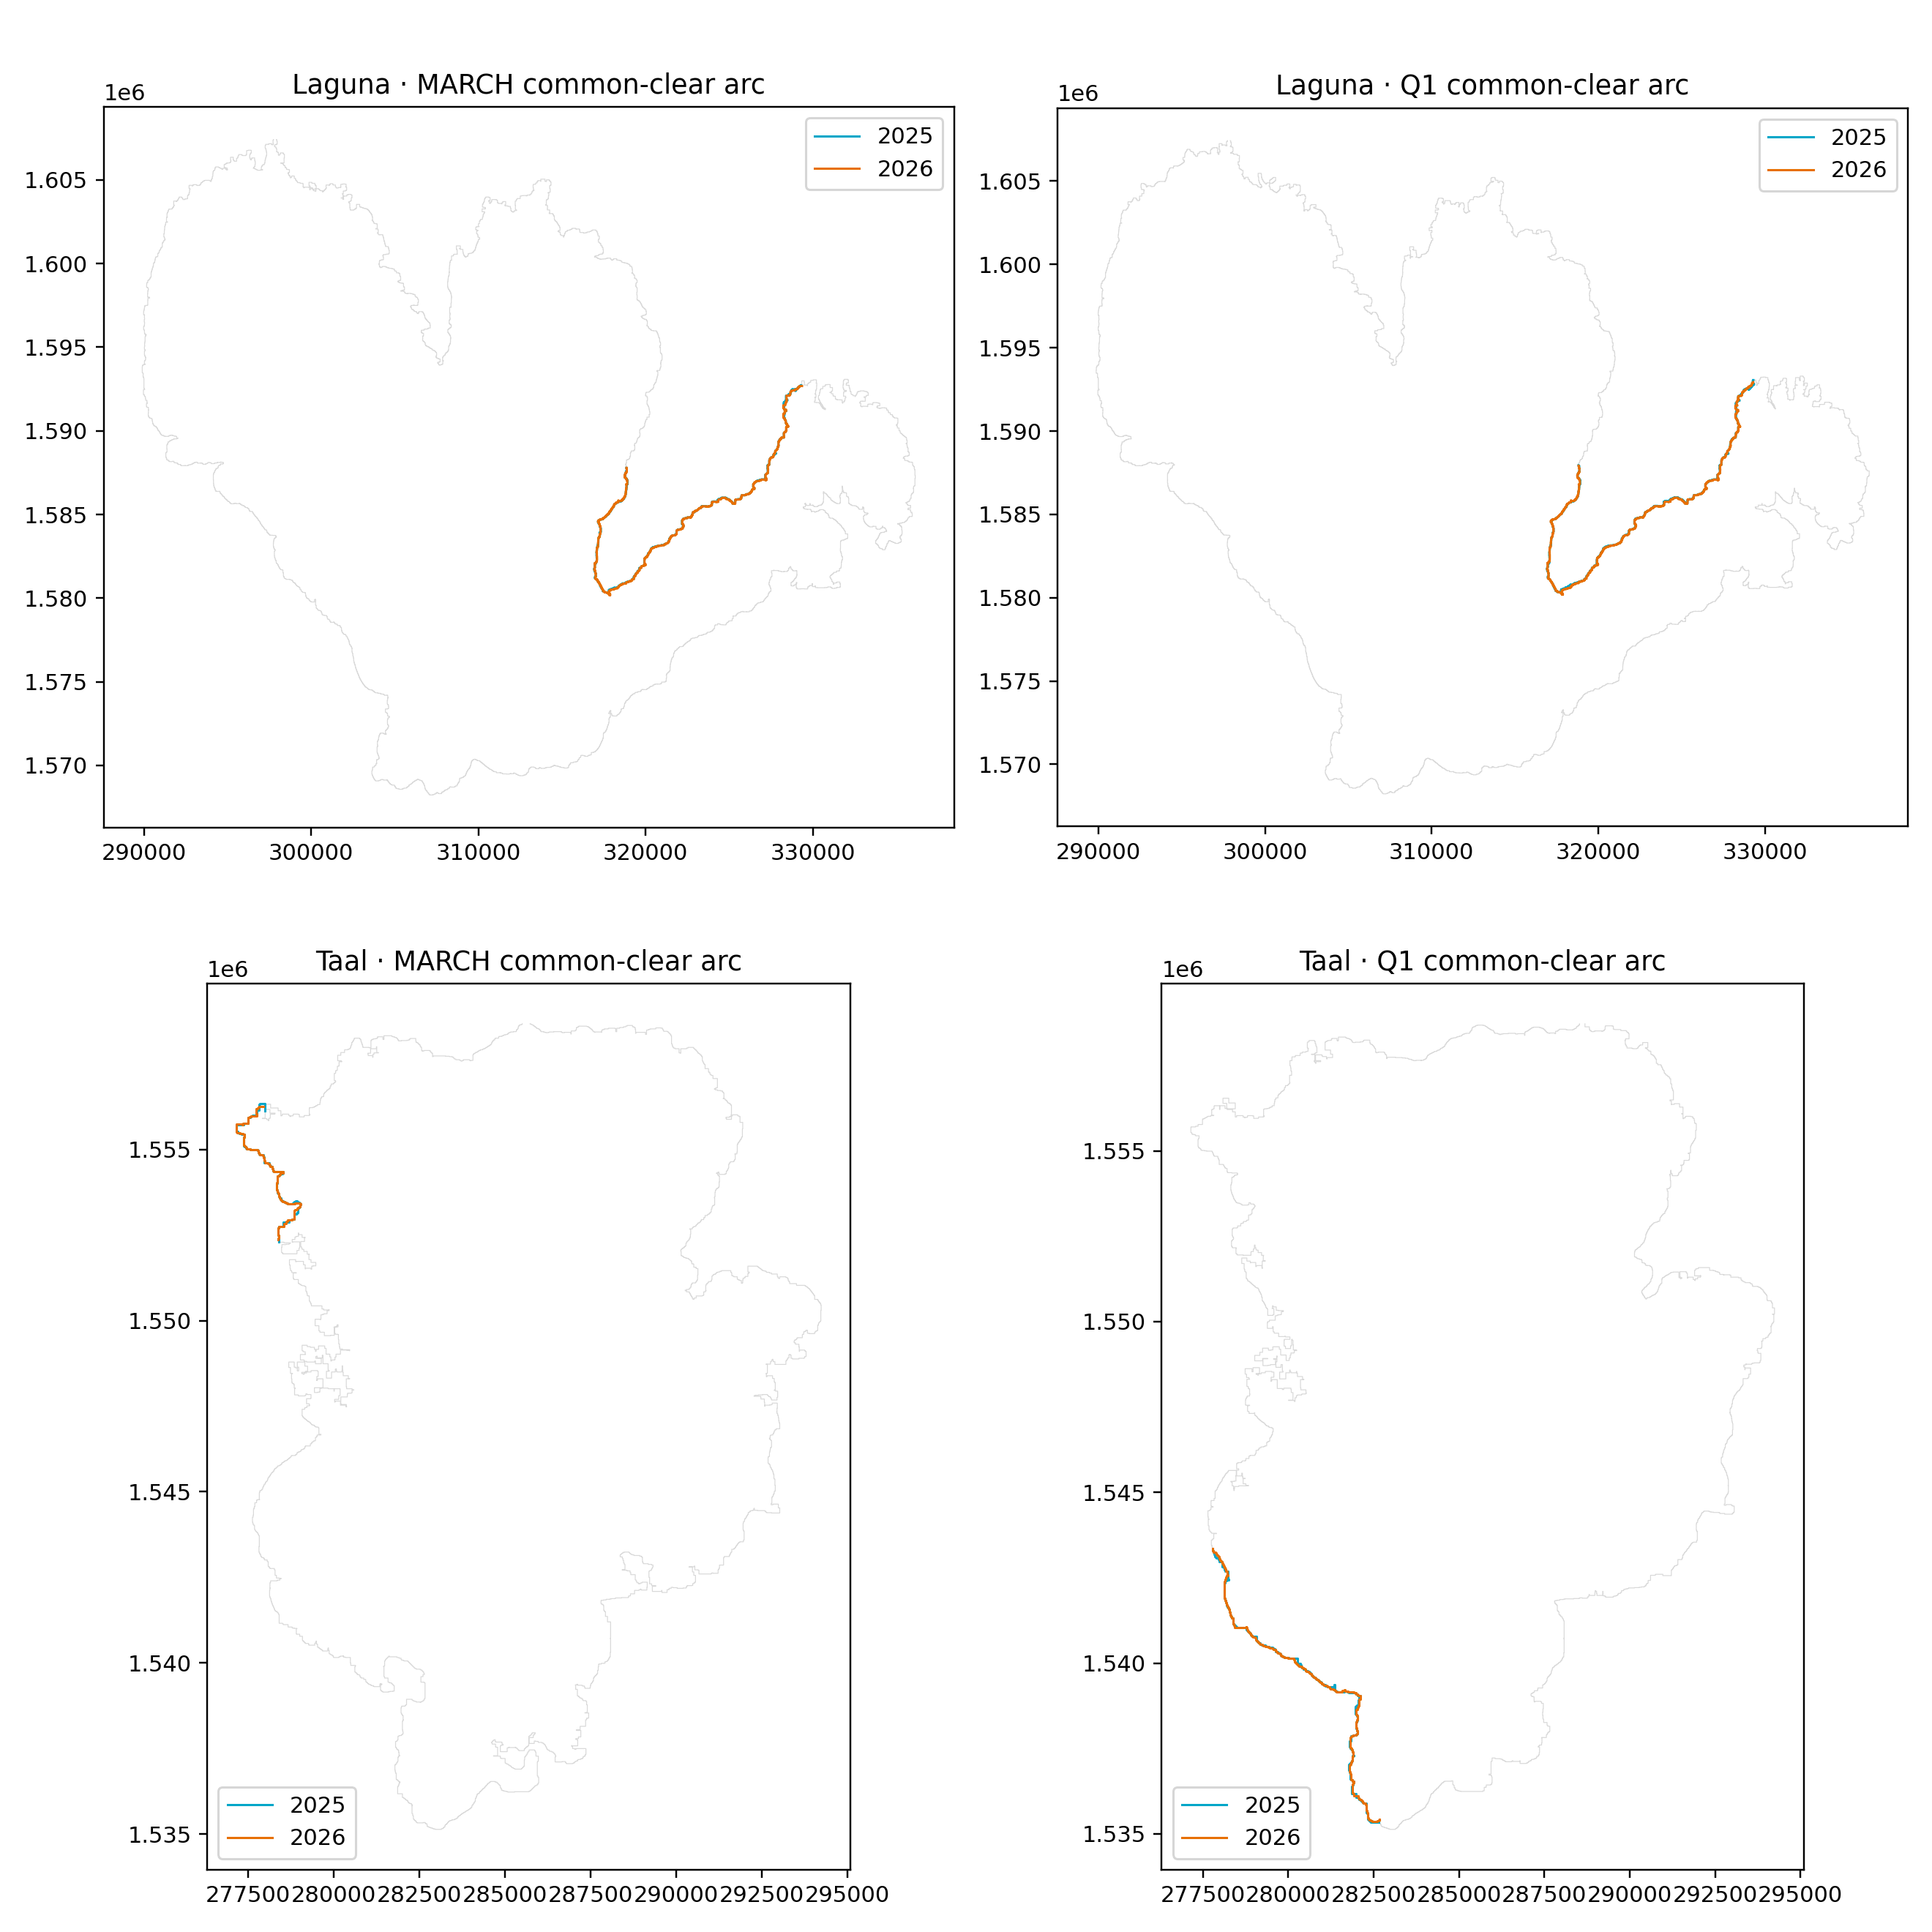
Open shoreline arcs kept at least 100 m from unknown pixels in both periods. Blue: 2025. Orange: 2026. March and January–March windows are reported separately. The robustness sweeps (24 start points, both walking directions, 16 grid placements) show how much of each change the measuring method alone can produce.
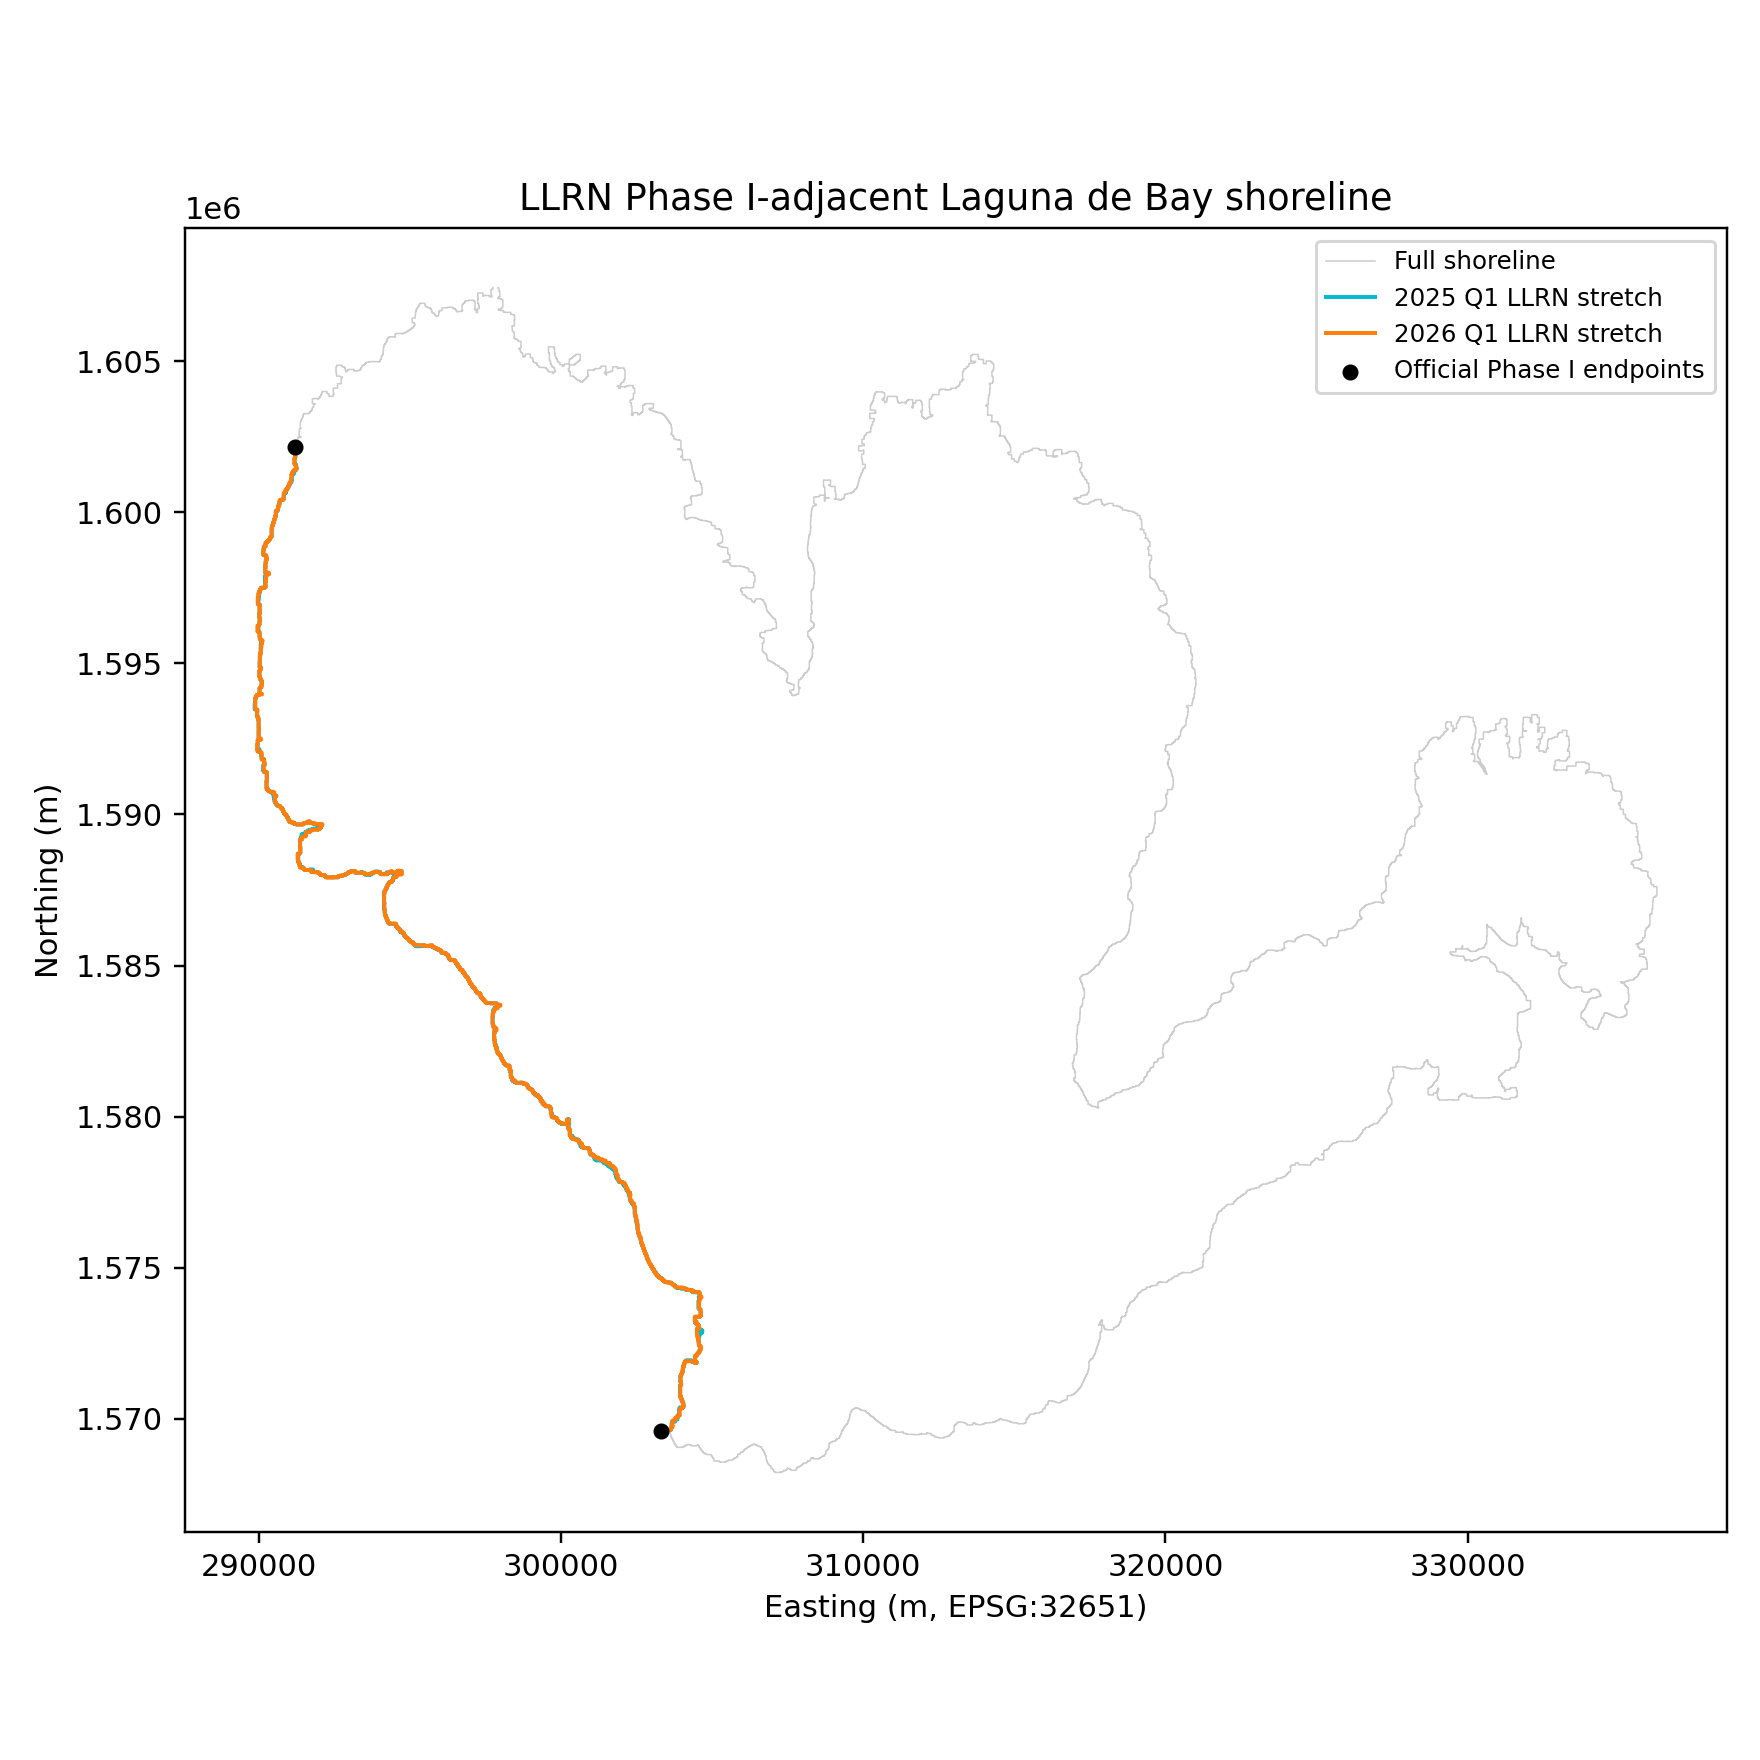
The full LLRN Phase I-adjacent corridor was clear in both January–March composites. Its walks rose by about 0.005 under every window and direction; box counting was less consistent. That rise is a quarter of the corridor's normal month-to-month variation, so we claim no construction signal.